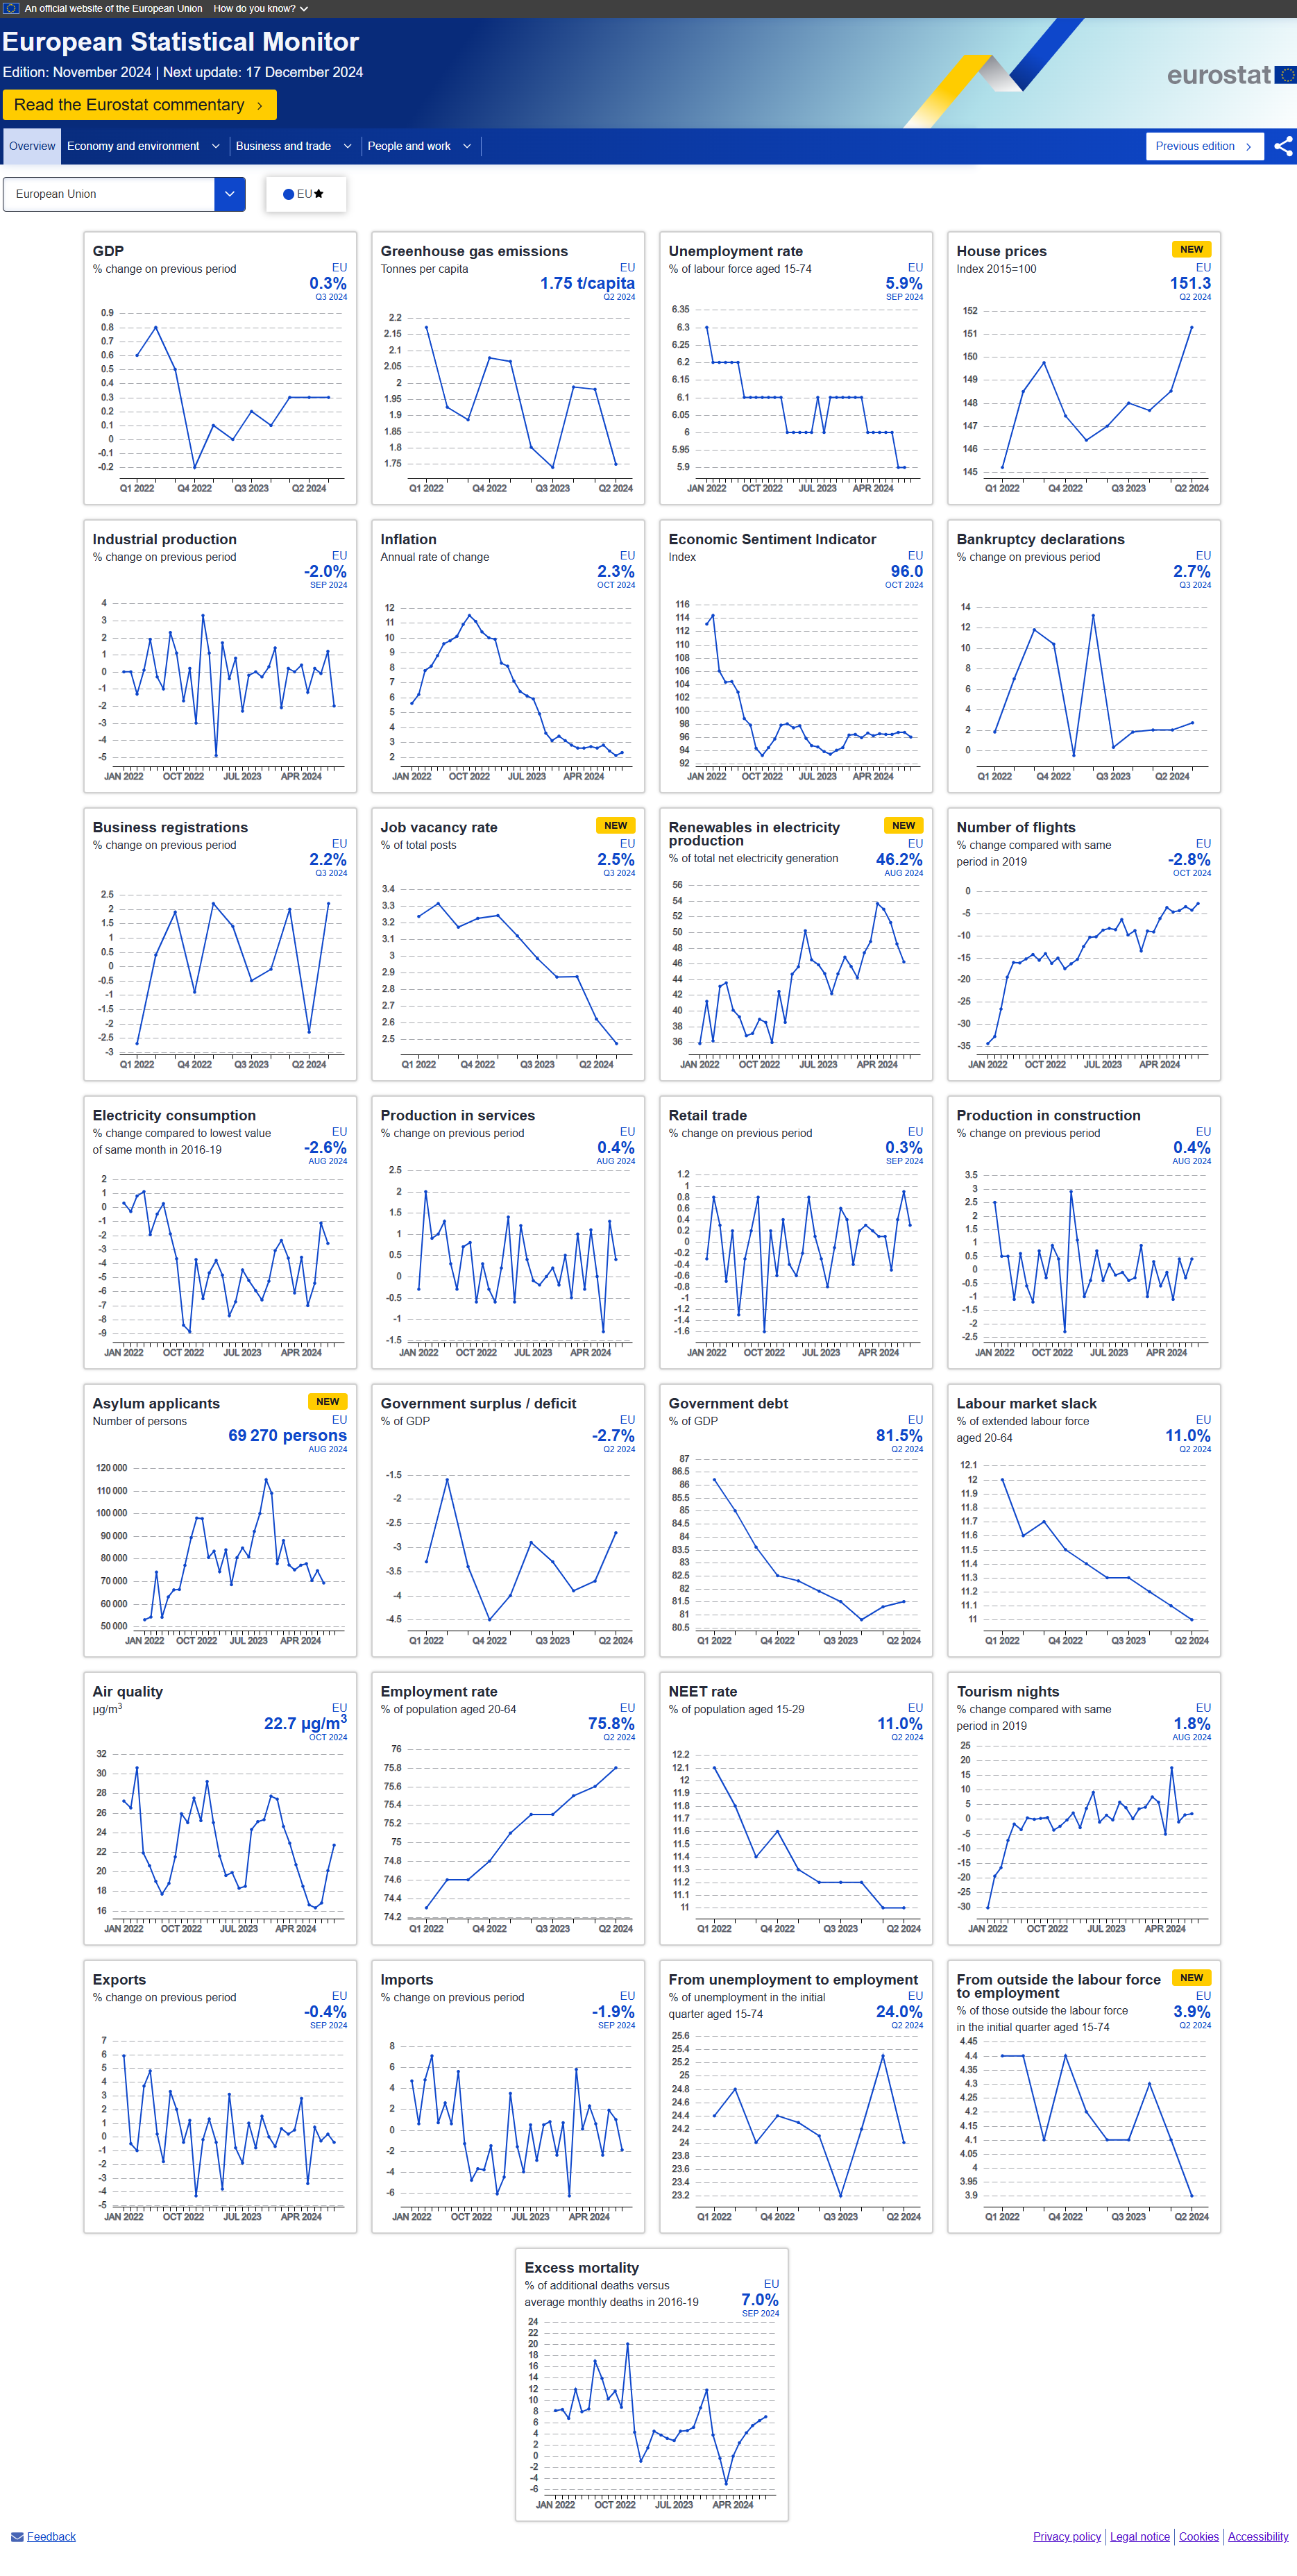
Eurostat has released the enhanced version of the European Statistical Monitor (ESM), a dashboard with short-term indicators covering 3 sections: economy and environment, business and trade, and people and work. The dashboard provides a holistic overview and essential insights of key developments across the EU and EFTA.
This upgraded ESM includes five new indicators:
- the indicator “renewable energy in net electricity generation”;
- the “quarterly house prices”, which allows for a close look at the evolution of residential property prices;
- 2 labour market indicators, “transition from outside the labour force to employment” and “job vacancy rate”, which monitors how the labour market moves and the level and structure of unmet labour demand;
- and the indicator “asylum applicants” on the number of third-country nationals or stateless persons who have submitted an application for international protection for the first time.
This monthly dashboard showcases monthly and quarterly indicators and ensures up-to-date insights. It also includes commentary focusing on recent changes and trends.
The EU economy maintained moderate growth and low unemployment, while decreasing its environmental impact
The EU economy continued to grow steadily, with GDP growing over the last three quarters at a stable 0.3% rate, and the unemployment rate in September 2024 maintained its historical low at 5.9%. Inflation picked up slightly, increasing by 0.2 percentage points in October, whilst economic sentiment stayed broadly unchanged, having remained below its long-term average since July 2022. House prices have risen over the last five quarters and in the second quarter increased by 1.9% compared to the previous quarter, and by 2.0% compared to the same quarter of the previous year.
As the EU strives to decrease its environmental impact, its share of net electricity generated from renewable energies reached 46.2% in August, a 15 percentage points increase since November 2021. Simultaneously, greenhouse gas emissions in the EU in the second quarter were recorded at 1.75 t/capita (tonnes per capita), a 11.6% decrease compared to the previous quarter and a 2.6% decrease compared to the same quarter in previous year. The average nitrogen dioxide (NO2) concentration in EU capital cities remains below the EU target and was recorded at 22.7 µg/m3 (micrograms per cubic meter) in October 2024.
You can read the full analysis by opening the Eurostat commentary linked in the dashboard’s header.

Share this article:
EU Reporter publishes articles from a variety of outside sources which express a wide range of viewpoints. The positions taken in these articles are not necessarily those of EU Reporter.


